Two zones generate more patient friction per square foot than any other area in a hospital: the emergency department waiting room and the radiology holding area.
Both share a structural characteristic: patients are waiting. They did not plan to be there. Their tolerance for ambiguity is low. The clock is running.
HCAHPS does not isolate either zone.
The Hidden Friction Zones
Emergency department patient experience is captured in HCAHPS — partially. The survey includes questions about responsiveness and communication. It does not isolate the waiting room from the treatment area. It does not identify which phase of the visit drove the rating.
Radiology is not directly measured at all in standard HCAHPS composites. A patient who waited 55 minutes in radiology holding due to schedule compression on a busy afternoon reports that experience in their overall satisfaction rating — unattributed, indistinguishable from any other element of the visit.
The result is a consistent pattern across hospital systems: aggregate satisfaction scores that mask zone-specific, operationally addressable friction in exactly the departments where friction is highest.
The friction is real. The data is not surfacing it.
What Hotspot Identification Changes
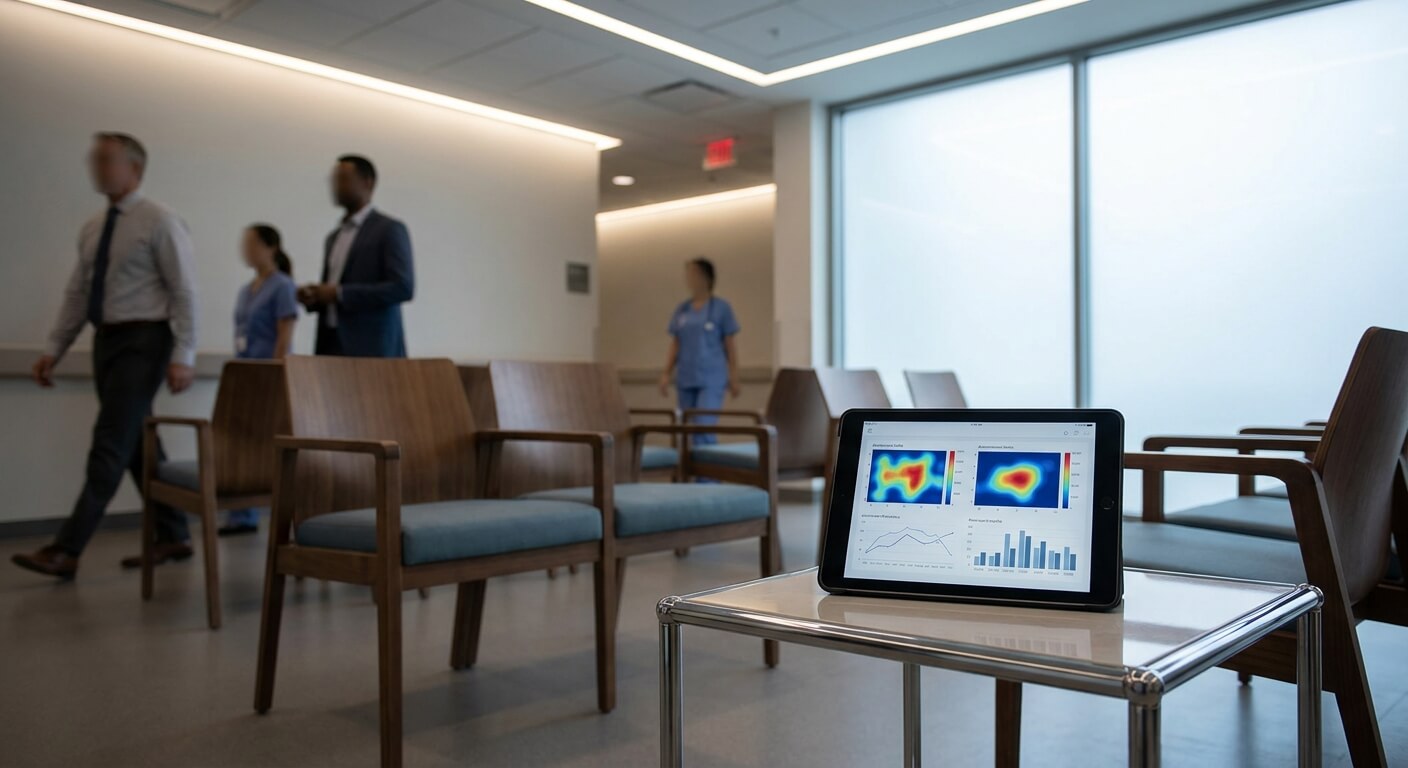
Real-time feedback deployed in ED waiting areas and radiology holding zones captures the signal that HCAHPS misses: satisfaction by location, by hour, and by day of week.
The operational value is not in the average score. It is in the pattern — the shift windows, the specific days, and the time-of-day curves that reveal when a zone crosses from acceptable to high-friction.
For example, a hospital deploying real-time feedback across its ED, radiology holding, and trauma intake areas might discover that its radiology holding zone generates elevated negative feedback primarily during a midday window, driven by schedule compression during physician overlap changes. That type of pattern would likely remain invisible in HCAHPS data but become apparent through hourly operational reporting.
The same hospital might also find a different pattern in its ED waiting room. Satisfaction could remain relatively stable until wait times approach a specific threshold, then decline sharply despite subsequent clinical interactions. Rather than showing a gradual deterioration, the data may reveal a clear tipping point that helps operations teams understand when intervention becomes most valuable.
Both patterns have identifiable operational causes. Both can support targeted operational responses. Neither is likely to emerge from traditional post-discharge reporting alone.
The Hotspot Report vs. The Morning Summary
Most hospital operations teams receive end-of-day or weekly reports. Aggregate satisfaction data. Trending analysis. Summary of alert volume.
These reports are useful for identifying systemic patterns over time. They are not useful for managing what is happening on a floor right now.
The operational difference is between learning that satisfaction in radiology holding averaged 68% last week — and knowing, at 10:45 AM, that satisfaction in radiology holding has been below threshold for the past 90 minutes and is trending down.
The first belongs in a strategic review. The second belongs in an operations manager's hands while it is still happening.
For example, a hospital using automated real-time reporting — with scheduled shift-specific satisfaction summaries alongside live alerts for below-threshold events — might discover that satisfaction in its ED consistently declines during a Friday afternoon transition period, when staffing changes coincide with rising patient volume.
That pattern may have existed for months without being visible because aggregate weekly reports obscure intra-day and intra-week variation. Once identified, the operational response can be straightforward: adjusting staffing coverage during that transition window.
The satisfaction pattern can improve — not because the ED changed its clinical protocols, but because operations teams gained the visibility needed to intervene at the right time.
Shift-Level Accountability
The operational value of real-time hotspot identification extends beyond response. It creates shift-level accountability.
When satisfaction data is available by zone, by hour, and by shift, operations managers can identify not just which zones are underperforming, but which shifts and which staffing configurations correlate with the underperformance.
That is information that patient experience surveys cannot provide. HCAHPS data arrives weeks after the shift in question. Real-time feedback data is available during and immediately after.
For hospital administrators managing workforce performance, this changes the accountability infrastructure: from retrospective analysis of aggregated quarterly scores to continuous visibility into shift-level operational performance.
The Bottom Line
Emergency departments and radiology holding areas are the highest-friction zones in most hospitals. They are also the least well-served by traditional feedback infrastructure. HCAHPS cannot isolate them. Post-discharge surveys cannot time-stamp the friction.
Real-time hotspot identification — satisfaction data captured continuously, segmented by zone and hour — gives hospital operations teams the visibility they need to act in the right place, at the right time, while the experience is still happening.
The complaint that never forms is worth more than the one that gets resolved.
See how FeedbackNow deploys real-time hotspot identification across hospital departments.
Contact us to learn more about how FeedbackNow can help improve your customer experience and operations!