The FeedbackNow Global Airport Index


Lo que ve (quejas, pérdida de ingresos) es solo la punta del iceberg: desbloquee soluciones de precisión con datos en tiempo real y análisis predictivos para resolver los problemas ocultos.

The Global Airport Index helps airport operations and customer experience teams understand how airports are performing right now, where friction is building, and how their results compare with peers across the industry.

Cómo funciona

What is the a Flawless Experiences

Why airport leaders use the Index

Vaya más allá del análisis básico con una IA que anticipa las necesidades, automatiza las soluciones y mejora continuamente su experiencia del cliente.

  • Benchmark performance against peer airports
  • Va más allá de las alertas para recomendar acciones específicas, como mapas óptimos de reasignación de personal, programas de limpieza prioritarios y protocolos de recuperación del servicio.
  • Detecta y alerta automáticamente sobre los aumentos atípicos del tiempo de espera, los picos anormales de quejas por limpieza y las palabras clave emergentes con sentimientos negativos.
  • Give stakeholders a consistent measure of airport experience over time
A man sitting in an airport waiting area with a large bag on the floor next to him and blurred figures walking past in the background near blue wheelchairs.
Ventajas de CX

What Each Quarterly Report Delivers

Mejora de la satisfacción de los empleados

Las empresas con una CX superior registran un crecimiento de ingresos dos veces mayor y un 60% más de gasto por cliente.
‍

Puntuaciones más altas de satisfacción del cliente

Haga más con menos: las herramientas de CX predictivas reducen los costos de resolución y mejoran la satisfacción.

Key Improvement Priorities

Las grandes experiencias hacen que los clientes tengan 6 veces más probabilidades de quedarse y desarrollar lealtad a la marca, lo que se traduce en un mayor ROI.

Emerging Operational Trends

Utiliza la detección para detectar con precisión el flujo de tráfico peatonal individual (entrada/salida) con precisión, superando a los sensores infrarrojos o de sonar tradicionales.

Reputación de marca más sólida

Los clientes satisfechos tienen 6 veces más probabilidades de recomendarte, lo que amplifica el crecimiento de forma orgánica.

Crecimiento constante y basado en datos

Un sistema que le permite escuchar continuamente a sus clientes abre oportunidades de ingresos y mejoras operativas permanentes para el futuro.
‍

Excelencia global en CX

Explore the Airport Index by quarter

The FeedbackNow
Global Airport Index
Q3 2026
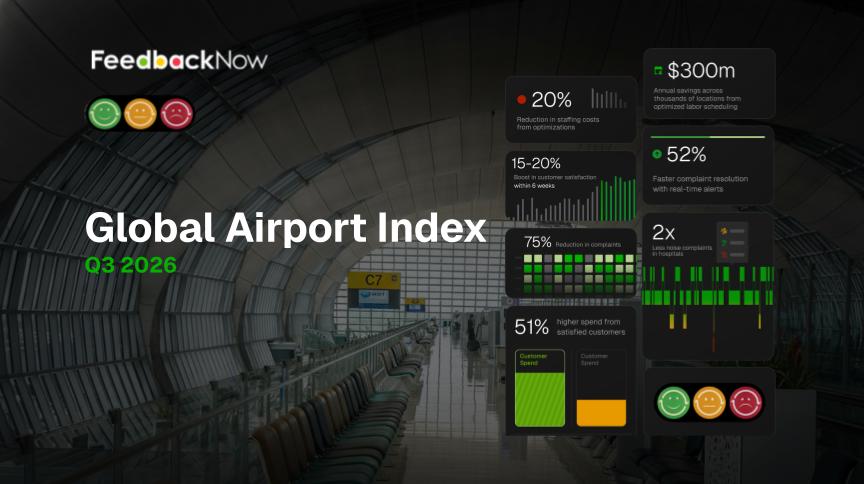
Graphic showing FeedbackNow Global Airport Index for Q3 2026 with various performance statistics over a blurred airport terminal background, including 20% reduction in staffing costs, $300 million annual savings, 15-20% boost in customer satisfaction, 52% faster complaint resolution, 75% reduction in complaints, twice fewer complaints by hospital staff, and 51% higher spend from satisfied customers depicted with colored charts and icons.

The FeedbackNow
Global Airport Index
Q2 2026
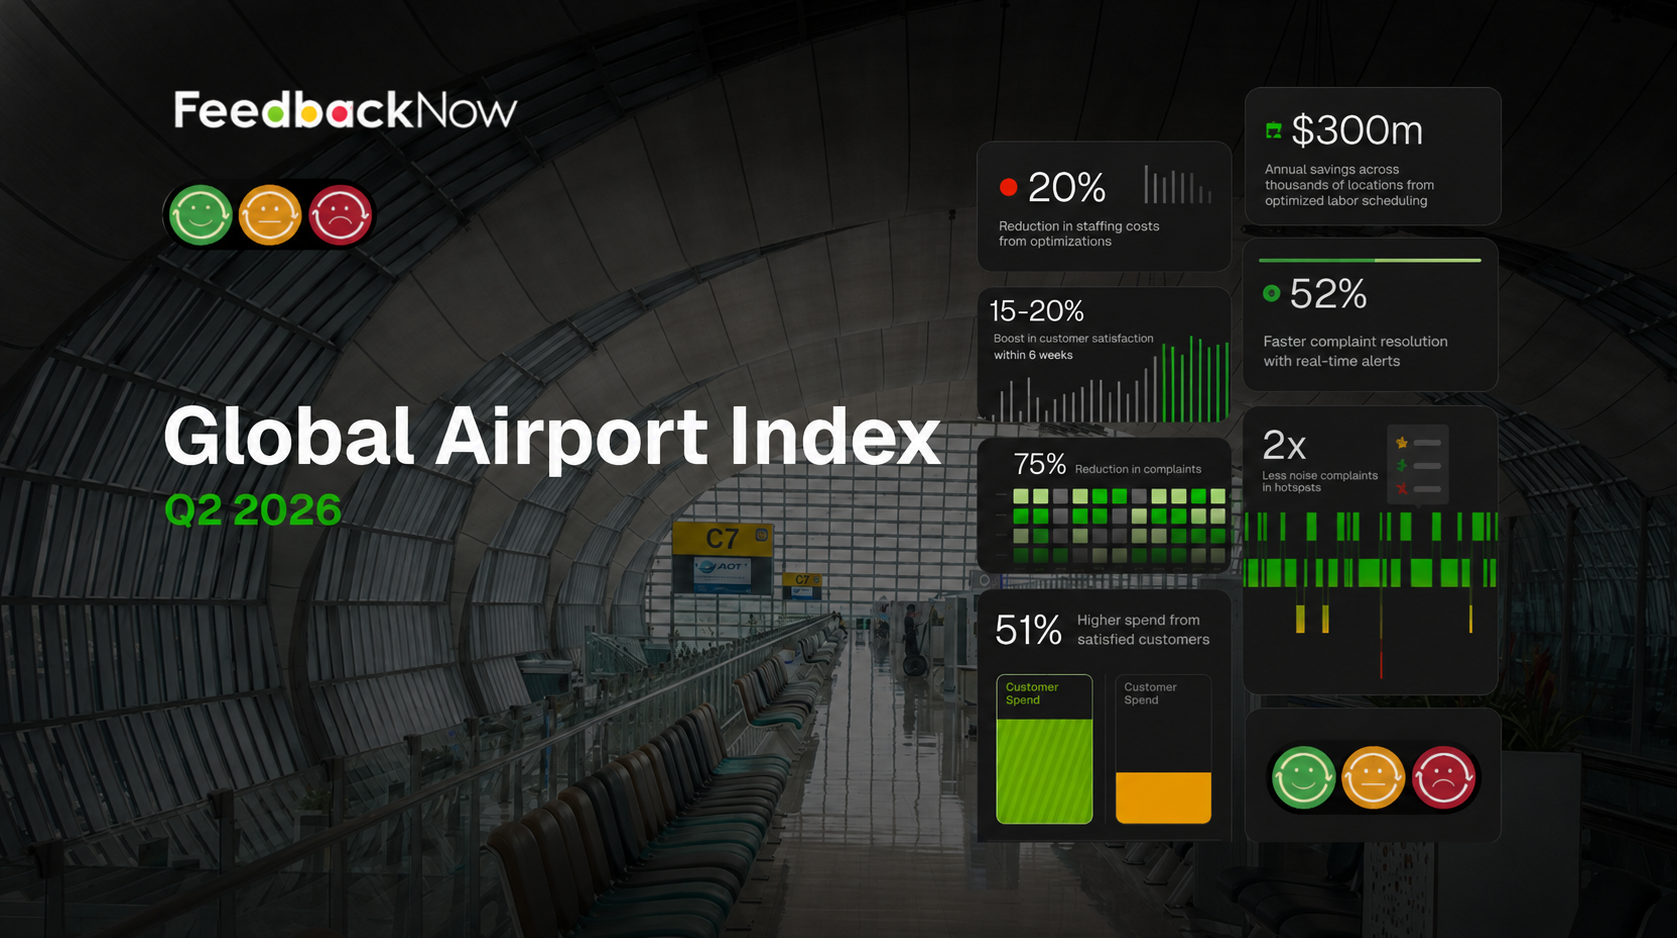
Infographic titled Global Airport Index Q2 2026 by FeedbackNow showing key statistics: 20% reduction in staffing costs, $300m annual savings from optimized labor scheduling, 15-20% boost in customer satisfaction within six weeks, 52% faster complaint resolution with real-time alerts, 75% reduction in complaints, twice fewer noise complaints in hotspots, and 51% higher spend from satisfied customers, with associated charts and smiley face feedback icons.

The FeedbackNow
Global Airport Index
Q1 2026

Airport terminal interior with curved roof and rows of empty seats, overlaid with feedback statistics including 20% reduction in staffing costs, $300 million annual labor savings, 15-20% boost in customer satisfaction, 52% faster complaint resolution, 75% reduction in complaints, 2x fewer noise complaints, and 51% higher customer spend, titled Global Airport Index Q1 2026 by FeedbackNow.

The FeedbackNow
Global Airport Index
Q4 2025

Infographic titled 'Global Airport Index Q4 2025' by FeedbackNow with visual statistics on customer satisfaction and operational improvements, including 20% reduction in staffing costs, $300 million annual savings, 15-20% boost in customer satisfaction within six weeks, 52% faster complaint resolution, 75% reduction in complaints, two times fewer noise complaints in hospitals, and 51% higher spend from satisfied customers, accompanied by satisfaction icons and bar graphs overlaid on an empty airport terminal interior.

The FeedbackNow
Global Airport Index
Q3 2025

Global Airport Index Q3 2025 by FeedbackNow showing key metrics: 20% reduction in staffing costs, 15-20% boost in customer satisfaction within 6 weeks, $300 million annual savings from labor scheduling optimization, 52% faster complaint resolution with real-time alerts, 75% reduction in complaints, 2x fewer noise complaints in hospitals, and 51% higher spend from satisfied customers compared to dissatisfied ones.

The FeedbackNow
Global Airport Index
Q2 2025

Global Airport Index Q2 2025 dashboard by FeedbackNow showing key performance metrics: 20% reduction in staffing costs, 15-20% boost in customer satisfaction within six weeks, $300 million annual savings from optimized labor scheduling, 52% faster complaint resolution with real-time alerts, 75% reduction in complaints, twice fewer noise complaints in hospitals, and 51% higher customer spend from satisfied customers, displayed over a background image of an empty airport terminal seating area.
U.S. Department of Veterans Affairs (VA)
SFO
Sogeag Airport
VA Northeast
ABM
Crothall Healthcare
Port Authoirty
Pharmacie Principale
Avia
Total autoroutes
Total Energies
Airport De Cameroon
vinci airport
Eurocommercial
Red De Carreteras De Occidente
Hospital Riviera
Hospital Geneve
Euroairport
Grupo Aeroportuario
Diriyah
Starling
Svicom
Napoli
Manchester Airport
transpennine
Schiphol
Dusseldorf
Stuttgart
Fraport
La Colonia
GSR
Nestle
SEA Milan Airports
Padnos
UK Health
WorldSprings
Beacon Capital
YUL
YWG
WakeMed
Vinart
VA San Diego
UPenn
USA Health HHS
University of Michigan
Spa Finlandais
Urban Tech Xchange
UNC
UCLA Anderson School of Management
Stinker
ThermoFisher
Premier Health/Miami Valley
PANYNJ
Road Ranger
SD LGBT
Phoenix Sky Harbor
NYU
South Nassau
ONT
NYRA
Monmouth
New Hampshire Group
MWAA IAD
NCL
Mobile County
Montefiore
LGA Terminal B
Love's
Lumbermen's
Morgan County
Fuel City
Glen Ivy
GWCC
HCA/JFK
LBC
GRR
Ford
ICM
CBRE IM
Florida A&M
Commonwealth Financial
City of Burlington
Chumash Casino
Boston Med Center
Brearly
Blue Water Development
Boston Logan
BJC
CH Alliance
Boston Symphony Orchestra
Cherokee County
Amtrak
AMA ASSN
BDC
Austin FC
American Airlines (JFK T8)
U.S. Department of Veterans Affairs (VA)
SFO
Sogeag Airport
VA Northeast
ABM
Crothall Healthcare
Port Authoirty
Pharmacie Principale
Avia
Total autoroutes
Total Energies
Airport De Cameroon
vinci airport
Eurocommercial
Red De Carreteras De Occidente
Hospital Riviera
Hospital Geneve
Euroairport
Grupo Aeroportuario
Diriyah
Starling
Svicom
Napoli
Manchester Airport
transpennine
Schiphol
Dusseldorf
Stuttgart
Fraport
La Colonia
GSR
Nestle
SEA Milan Airports
Padnos
UK Health
WorldSprings
Beacon Capital
YUL
YWG
WakeMed
Vinart
VA San Diego
UPenn
USA Health HHS
University of Michigan
Spa Finlandais
Urban Tech Xchange
UNC
UCLA Anderson School of Management
Stinker
ThermoFisher
Premier Health/Miami Valley
PANYNJ
Road Ranger
SD LGBT
Phoenix Sky Harbor
NYU
South Nassau
ONT
NYRA
Monmouth
New Hampshire Group
MWAA IAD
NCL
Mobile County
Montefiore
LGA Terminal B
Love's
Lumbermen's
Morgan County
Fuel City
Glen Ivy
GWCC
HCA/JFK
LBC
GRR
Ford
ICM
CBRE IM
Florida A&M
Commonwealth Financial
City of Burlington
Chumash Casino
Boston Med Center
Brearly
Blue Water Development
Boston Logan
BJC
CH Alliance
Boston Symphony Orchestra
Cherokee County
Amtrak
AMA ASSN
BDC
Austin FC
American Airlines (JFK T8)