In a normal setting, a 68.5% satisfaction score might prompt a quarterly review.
At a major sporting event, it means thousands of fans are actively having a below-threshold experience - right now, in real time, with social media in their pockets.
The Numbers Behind the Championship
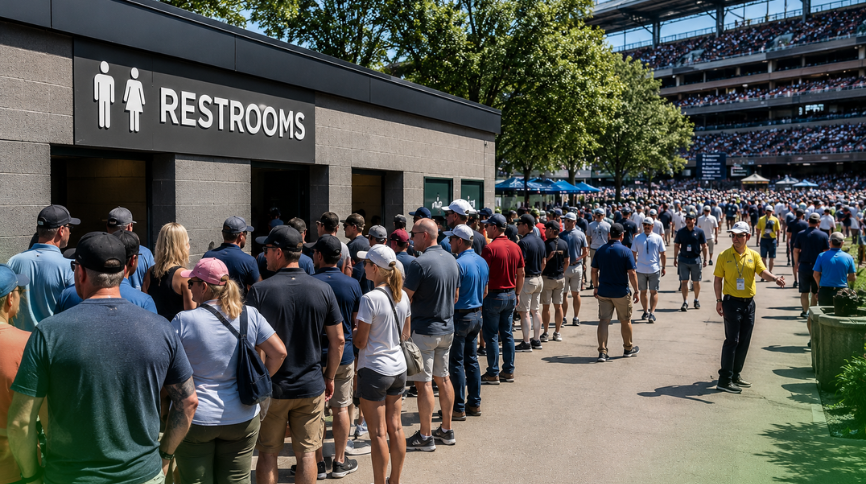
Across the event, 3,820 fans logged feedback through FeedbackNow kiosks. Average restroom satisfaction: 68.5%. But the variance was the story.
On peak days at the 18th hole, satisfaction dropped significantly. Reason codes revealed: congestion, perceived line unfairness, and signage failures - not cleanliness.
The facilities were maintained. The system failed.
Why Events Break Traditional Operations Models
Stadium and venue operations teams face a challenge permanent facility managers don't: compressed time windows with unpredictable demand spikes. A 15-minute gap between a cleaning cycle and a demand surge is the difference between a fine experience and a viral complaint.
Three Operational Changes the PGA Data Recommended
- Real-time threshold alerts at high-traffic restroom banks
- Satisfaction data to drive dynamic signage - redirect guests to less-congested alternatives
- People counters to pre-position staff before demand peaks rather than react after
The Expanding Venue Opportunity
Following PGA, FeedbackNow is deploying at theme parks and amusement venues (SeaWorld, Universal Orlando in pipeline). Same dynamics: high-volume, unpredictable demand, zero tolerance for operational failure.
Is your event or venue running on real-time intelligence or last season's data? See how FeedbackNow deploys for events and venues.
Contact us to learn more about how FeedbackNow can help improve your customer experience and operations!